多次plot
多次plot
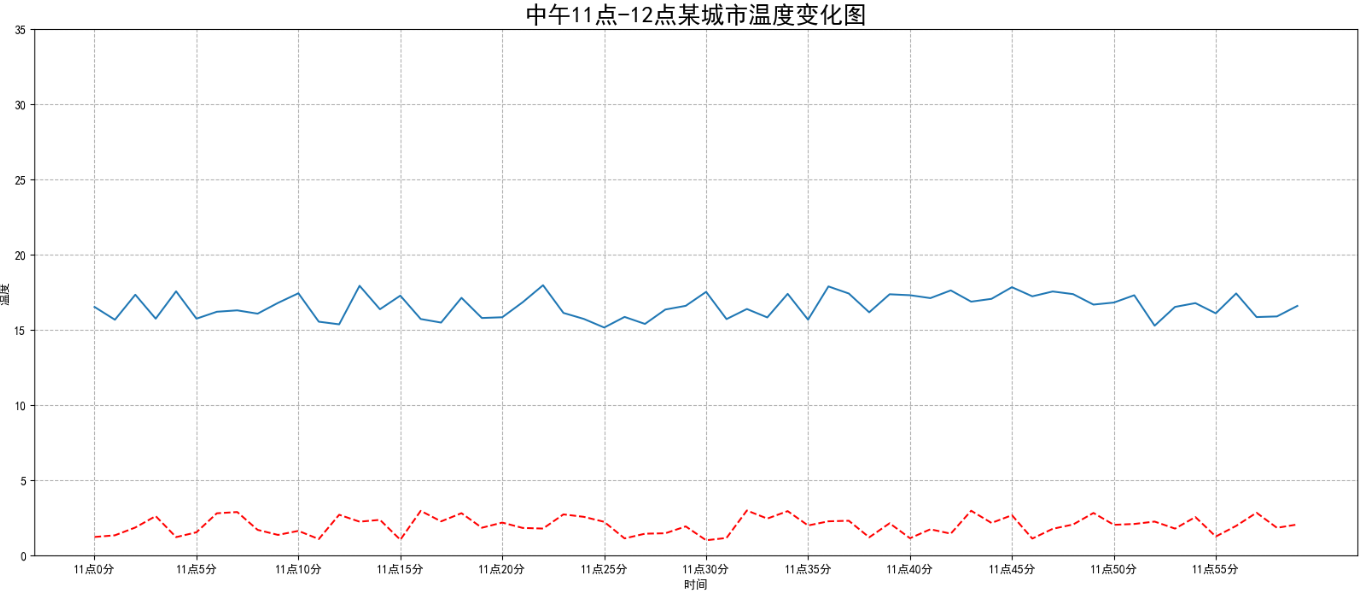
# 添加北京的数据
y_beijing = [random.uniform(1, 3) for i in x]

# 绘制北京的数据
plt.plot(x, y_beijing)
# 自定义风格
plt.plot(x, y_beijing, color='r', linestyle='--')
# 添加北京的数据
y_beijing = [random.uniform(1, 3) for i in x]
# 绘制北京的数据
plt.plot(x, y_beijing)
# 自定义风格
plt.plot(x, y_beijing, color='r', linestyle='--')